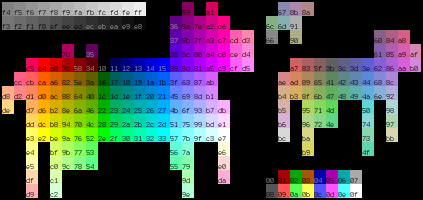
Announcing XTerm Colour Chart 2.0 “Old and busted: Colour Cubes. New hotness: Colour Cows” release.
The script has been completely rewritten. It now requires python 2.3 or later for the optparse command-line parsing module.
Many new features have been added to this version:
- Five different charts available in 256 and 88-colour modes
- Origin and rotation of colour cube is now configurable
- Size of colour cells is now configurable
- Colour palette now exactly matches xterm defaults
- Resetting colour palette is now flicker-free
- Source code is much nicer (and commented!)
Usage
Usage: xterm_colour_chart.py [options] [chart names]

Options:
  --version             show program's version number and exit
  -h, --help            show this help message and exit
  -8, --88-colours      use 88-colour mode [default: 256-colour mode]
  -l, --list-charts     list available charts
  -o NUM, --origin=NUM  set the origin of the colour cube: 0-7 [default: 0]
  -a NUM, --angle=NUM   set the angle of the colour cube: 0-5 [default: 0]
  -n, --numbers         display hex colour numbers on chart
  -x COLS, --cell-columns=COLS
                        set the number of columns for drawing each colour cell
                        [default: 2]
  -y ROWS, --cell-rows=ROWS
                        set the number of rows for drawing each colour cell
                        [default: 1]
  -r, --reset-palette   reset the colour palette before displaying chart, this
                        option may be used to switch between 88 and 256-colour
                        modes in xterm
